

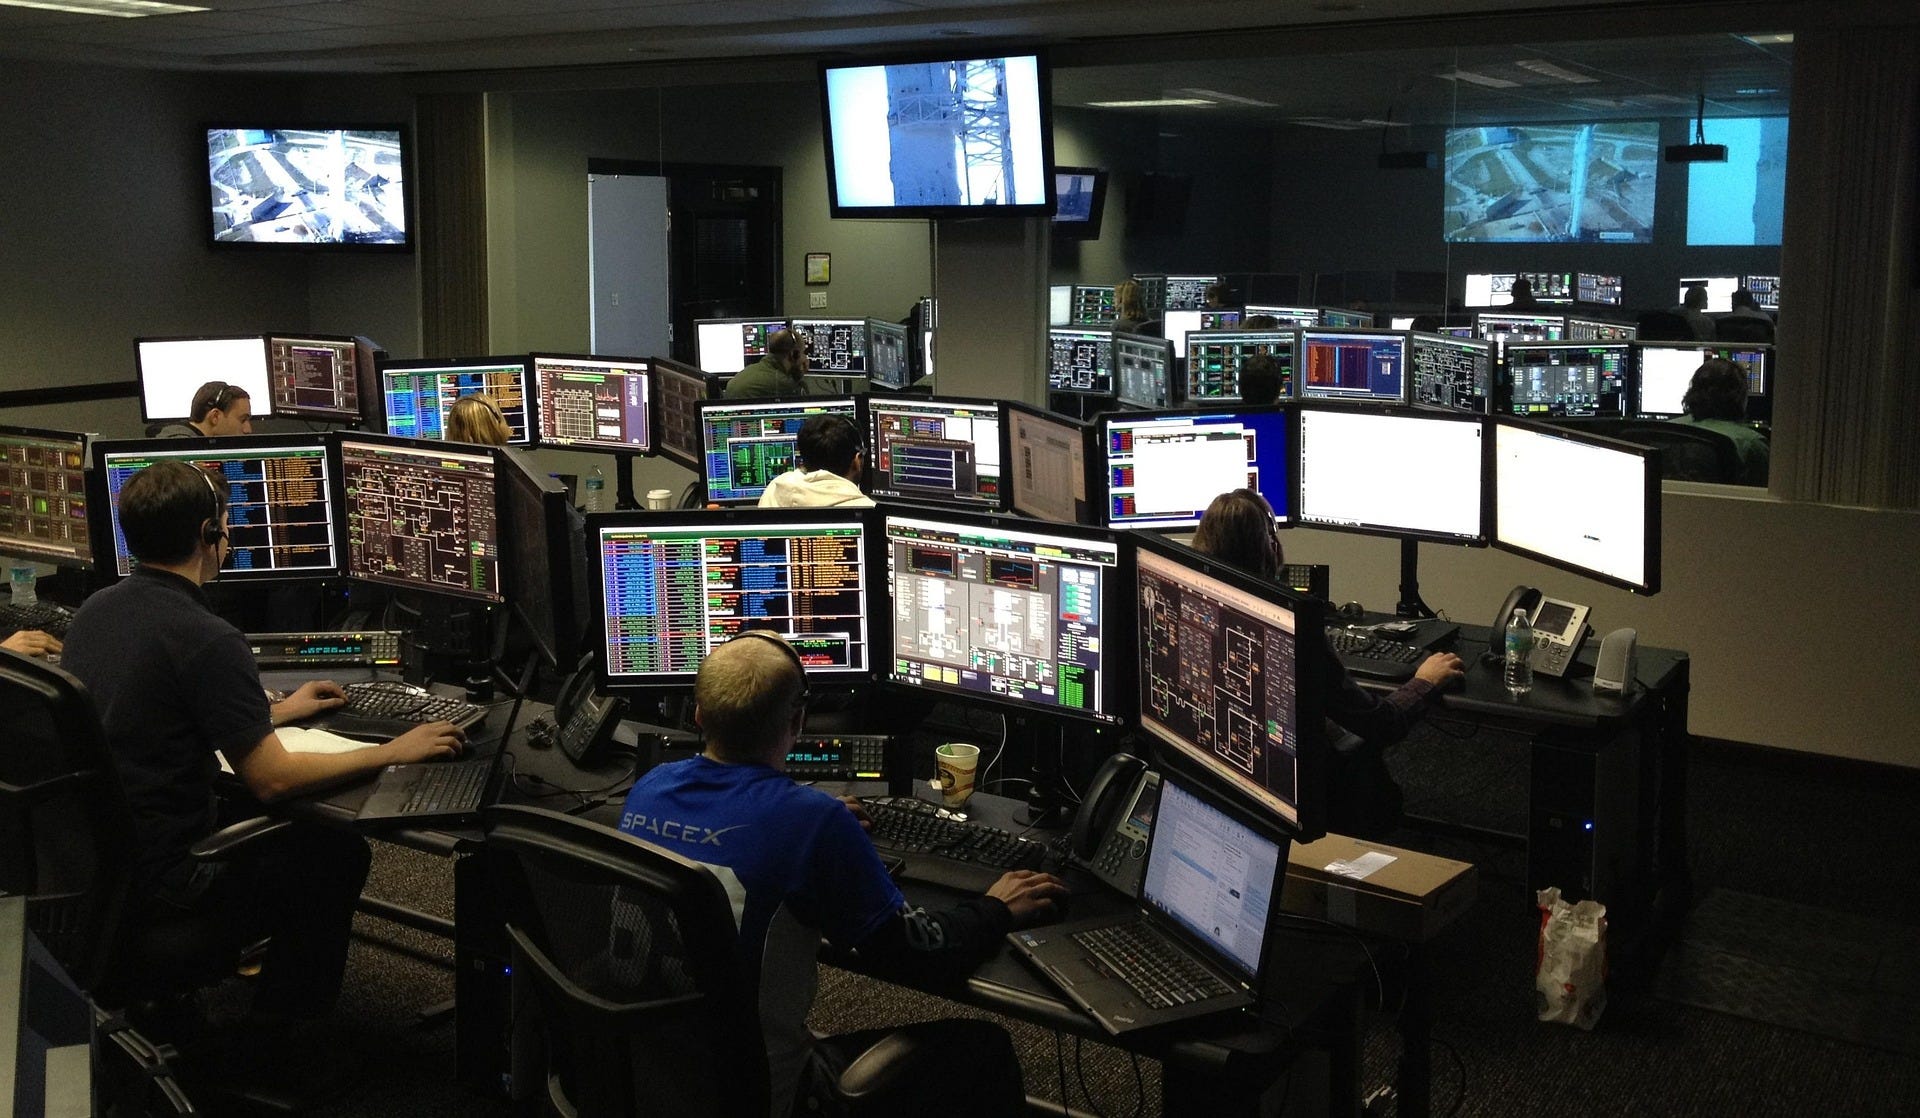
Most engineering teams don’t suffer from a lack of monitoring. They suffer from an excess of signals. As systems mature, dashboards multiply. Every service exports dozens of metrics. Logs are retained for months. Distributed tracing spans thousands of requests. Alerts become increasingly granular. From the outside, the platform appears highly observable. Yet when an incident occurs, the first question is often the same: “Where do we even start?”
The assumption that more telemetry naturally leads to better observability is one of the most persistent misconceptions in platform engineering. Monitoring measures what a system emits. Observability determines whether those signals are sufficient to explain its behavior under uncertainty. Those are related ideas, but they are not the same. The difference becomes critical in modern data platforms, where decisions must be made while the incident is still unfolding.
Consider a streaming data pipeline processing payment events on Google Cloud. Transactions arrive through Pub/Sub, are transformed by Dataflow, written into BigQuery, and consumed by downstream fraud detection services. One morning, latency suddenly increases. Consumer lag grows, dashboards turn red, and on-call engineers receive dozens of alerts within minutes.
Nothing is technically missing. CPU metrics are available. Memory utilization is normal. Network throughput looks healthy. Every component exports detailed logs. Distributed traces exist for most requests.
The problem is not insufficient monitoring. The problem is that engineers have too much information and too little explanation.
Conventional thinking often responds by adding even more telemetry. Additional dashboards are created. More application logs are enabled. New custom metrics are exported. Trace sampling rates increase. The assumption is straightforward: if visibility is incomplete, collect more data. This strategy frequently makes diagnosis harder.
Every new metric introduces another possible interpretation. Every dashboard offers another explanation. Every alert competes for attention. Eventually, the operational challenge shifts from understanding system behavior to filtering observational noise.
This resembles a pattern found in statistical learning. Beyond a certain point, additional variables contribute progressively less information while increasing complexity and the risk of false relationships [1]. Platform telemetry behaves in much the same way.
The engineering objective should therefore change. Instead of asking whether the platform exposes enough signals, ask whether it exposes the minimum signals required to explain the failure before the operational deadline expires.
This perspective fundamentally changes observability design. Imagine redesigning the payment pipeline from the viewpoint of the on-call engineer rather than the infrastructure itself.
The first operational question is rarely whether CPU utilization reached 73%. It is usually much simpler. “Has the system stopped processing events?”
If that question cannot be answered within seconds, the observability strategy has already failed.
A lightweight Google Cloud architecture reflects this philosophy. Transactions enter Pub/Sub and are processed by Dataflow before being persisted into BigQuery. Cloud Monitoring collects infrastructure metrics, while Cloud Logging captures structured application events. Instead of exporting every possible measurement, the platform derives a small set of operational indicators: end-to-end processing latency, consumer backlog, successful event throughput, pipeline error rate, and data freshness inside BigQuery. These signals describe system behavior rather than individual components.
During an incident, engineers begin with these indicators. Only if necessary do they drill into traces, logs, or infrastructure metrics. The difference appears subtle, but it changes incident response dramatically. Observability becomes hierarchical rather than exhaustive. This approach also creates healthier engineering trade-offs.
Collecting fewer signals reduces storage costs, dashboard maintenance, metric cardinality, and alert fatigue. More importantly, it reduces cognitive latency—the time required for engineers to understand what is happening.
Engineering teams frequently optimize computational latency while ignoring human latency. Both matter. A pipeline that processes events in five seconds but requires forty minutes to diagnose during failure is not operationally efficient.
This is where the perspective inspired by Data S2 becomes useful. In real-time decision systems, context has value only while it contributes to the decision. Additional telemetry should therefore justify its existence by reducing uncertainty during operational diagnosis. Otherwise, it becomes infrastructure noise.
This principle applies equally to artificial intelligence systems. Many organizations now monitor token usage, prompt latency, model confidence, retrieval quality, vector search latency, embedding drift, and dozens of additional metrics. Those measurements are valuable. But during production incidents, engineers usually need to answer far simpler questions.
Is retrieval working?
Is the model responding?
Has response quality degraded?
Everything else supports those questions rather than replacing them.
Industry practices increasingly reflect this shift. Google’s Site Reliability Engineering emphasizes defining Service Level Indicators (SLIs) that directly capture user experience instead of monitoring every infrastructure detail [2]. Similarly, Honeycomb has popularized the idea that observability is fundamentally about enabling engineers to ask new questions during unknown failures rather than collecting larger quantities of telemetry [3].
These ideas converge on an important insight. Observability is not measured by the number of dashboards. It is measured by the speed with which uncertainty can be reduced.
Several implementation mistakes repeatedly prevent organizations from reaching this goal. One common mistake is exposing infrastructure metrics without mapping them to business outcomes. Engineers know disk utilization but cannot determine whether customers are affected. Another is creating independent dashboards for every service instead of designing views around complete operational workflows. Perhaps the most damaging mistake is treating alerts as indicators of importance rather than symptoms of uncertainty. Hundreds of alerts rarely produce clarity.
A handful of carefully selected operational signals often does. As data platforms become increasingly distributed, observability will become less about collecting telemetry and more about selecting it.
The next generation of engineering platforms will almost certainly generate even more metrics through AI agents, autonomous infrastructure, and increasingly dynamic systems. The competitive advantage will not belong to the teams that collect the most operational data. It will belong to the teams that know which signals deserve attention while the clock is still running.
If every metric claims to be important during an incident, how will your platform tell you which one actually matters?
References
[1] Hastie, T., Tibshirani, R., & Friedman, J. The Elements of Statistical Learning. Springer, 2009.
[2] Beyer, B., Jones, C., Petoff, J., & Murphy, N. Site Reliability Engineering: How Google Runs Production Systems. O’Reilly Media, 2016.
[3] Majors, C., & Fong-Jones, L. Observability Engineering. O’Reilly Media, 2022.
Disclosure, I work on operatex.dev, mentioning it since it's relevant here. The line about cognitive latency is the one that matters most. A pipeline that runs in five seconds but takes forty minutes to explain isn't actually fast, it just moved the slow part onto a person instead of a machine.