Smart KPIs: How Context Turns Data into Action
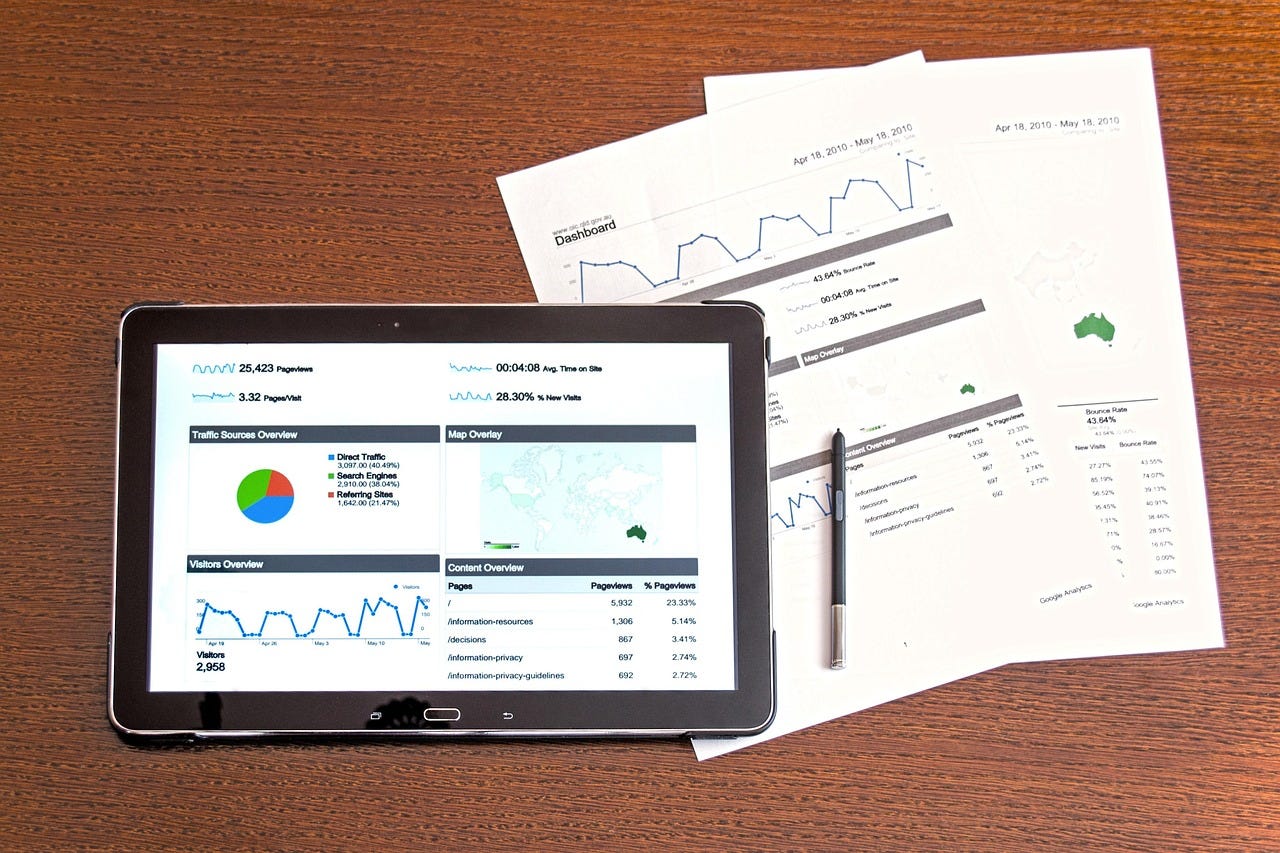
In today’s era of digital transformation, companies are flooded with data and performance indicators. Colorful dashboards and interactive reports promise to reveal the state of teams, products, and processes. However, a recurring problem undermines the value of all this measurement: KPIs that lack context.
Many teams track metrics without truly understanding what they represent. They measure what is easy — not what is meaningful. As a result, indicators that should guide decisions become numbers without a narrative, incapable of translating business reality or inspiring action.
The key question is: how can we design KPIs that tell stories — connecting data to decisions, and numbers to meaning?
How People Tend to Solve It
The most common approach is the creation of generic dashboards, fed by raw data, with no clear strategic purpose. Often, KPIs are defined in kickoff meetings or copied from market benchmarks without reflection on their relevance to the specific context of the organization. This leads to several issues:
Focus on vanity metrics, such as total users or page views, which do not reflect real value.
Fragmentation of indicators, where each department creates its own metrics without strategic alignment.
Lack of storytelling, making it difficult for leaders to understand why the numbers have changed and what actions to take next.
In practice, this results in “beautiful” dashboards that are ineffective for decision-making.
How It Should Be Automated or Solved
Building KPIs with context begins with a simple principle: data only tells stories when connected to objectives and causes. To achieve this, three dimensions must work together:
🎯 Purpose
Every KPI must answer a specific business question.
Example: “Is our churn rate reflecting a failure in customer experience?”
The KPI should emerge from a hypothesis — not just curiosity.
🧩 Context
No metric exists in isolation. Tracking a KPI without its temporal, comparative, and causal context is like watching a movie one frame at a time.
Automate analyses that include historical trends, goal comparisons, and correlations between metrics. Modern BI and machine learning tools can automatically identify anomalies and suggest causal explanations for performance variations.
🤖 Intelligent Automation
The next frontier is turning reports into data-driven decision systems.
Contemporary analytics platforms can deliver automated alerts, predictive insights, and AI-driven recommendations.
KPIs evolve from static observations into narrative agents capable of anticipating trends and guiding corrective actions.
Conclusion
KPIs that tell stories are more than numbers — they are bridges between data and decision. They carry purpose, context, and causality. In a world overflowing with information, competitive advantage comes from creating meaning.
The analytical maturity of an organization is not measured by the number of dashboards it produces, but by how clearly its indicators drive action.
When a KPI can answer not only “how much” but also “why” and “what comes next”, it ceases to be just a metric — it becomes part of the organization’s strategic narrative.
References
DAVENPORT, T. H.; HARRIS, J. G. Competing on Analytics: The New Science of Winning. Harvard Business Press, 2017.
FEW, Stephen. Information Dashboard Design: Displaying Data for At-a-Glance Monitoring. Analytics Press, 2013.
MARR, Bernard. Data Strategy: How to Profit from a World of Big Data, Analytics and the Internet of Things. Kogan Page, 2017.
ECKERSON, Wayne W. Performance Dashboards: Measuring, Monitoring, and Managing Your Business. Wiley, 2010.
Image: analysis analytics business charts by Pexels


